
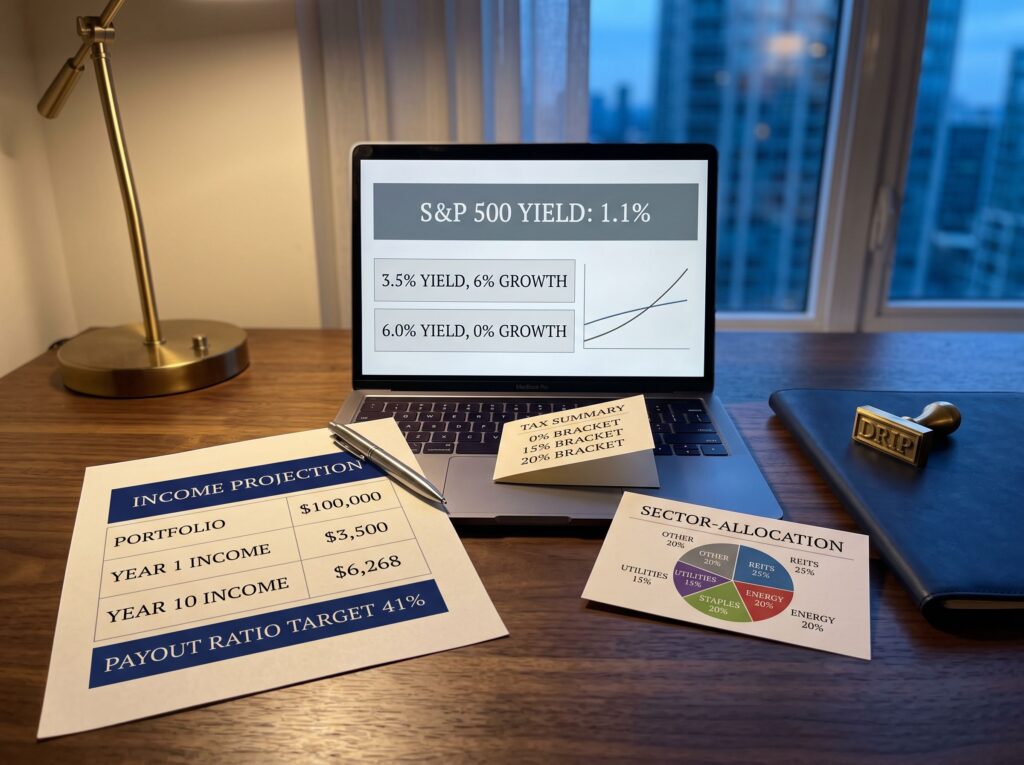
Finding the best dividend stocks for passive income is harder than it looks. The S&P 500 average dividend yield has dropped to roughly 1.1%, near the lowest level on record. If you want meaningful income from your portfolio, you cannot just buy an index fund and call it a day. You need a strategy.
That strategy starts with understanding the difference between high yield and reliable income. A stock yielding 8% looks great on a screen, but if the company cuts the dividend next quarter, you lose both the income and the capital. A stock yielding 3.5% with a history of raising its payout every year can generate more income over a decade than a static 8% yielder that never grows.
The short version: chasing the highest yield is a trap. Reliable income comes from healthy payout ratios, dividend growth, sector diversification, reinvestment, and tax-aware placement.
This guide covers the key decisions you need to make: yield versus growth, payout ratio red flags, sector diversification, the power of dividend reinvestment, and how taxes affect your take-home income. The goal is not to hand you a list of tickers. It is to give you a framework for building a portfolio that pays you reliably for years.
Dividend Yield vs Dividend Growth
Dividend yield is the annual dividend per share divided by the stock price. If a stock trades at $100 and pays $5 per year, the yield is 5%. Yield tells you how much income you get for every dollar invested right now. It does not tell you whether that income will grow, stay flat, or disappear.
Dividend growth is the rate at which a company increases its payout over time. A company with a 3% yield and 8% annual dividend growth will double your income in about nine years. A company with a 6% yield and no growth will still pay you 6% in nine years, but inflation will have eaten a chunk of its buying power.
Here is a rough comparison using real numbers. A $100,000 portfolio in a 3.5% yielding stock generates $3,500 in year one. If that dividend grows 6% per year, your income reaches about $6,268 by year 10. The same $100,000 in a 6% static yielder generates $6,000 in year one and $6,000 in year 10. The growth stock catches up near the end of the first decade and keeps pulling ahead.
| Year | 3.5% Yield, 6% Growth | 6.0% Yield, No Growth |
|---|---|---|
| Year 1 | $3,500 | $6,000 |
| Year 5 | About $4,684 | $6,000 |
| Year 10 | About $6,268 | $6,000 |
That math is why serious income investors focus on dividend growth stocks as the core of their portfolio. Companies with long streaks of annual increases, like Dividend Aristocrats and Dividend Kings, have built the discipline of raising payouts through good times and bad. Dividend Kings are companies that have increased their dividends for 50 or more consecutive years. PepsiCo is a good example. It has raised its dividend for 54 straight years and currently yields around 4.7%, which is historically high for the stock because Wall Street has been negative on it.
The trade-off is that growth stocks usually start with lower yields. You accept less income today in exchange for more income tomorrow. If you need maximum cash flow right now, a mix of higher-yield names and growth names makes sense. If you have a 10 or 20-year horizon, leaning more toward growth will pay off in the long run.
Yield tells you what you get today. Growth tells you what you will have tomorrow. The best income portfolios balance both.
Payout Ratio Red Flags
The payout ratio is the percentage of a company earnings or free cash flow that goes out the door as dividends. If a company earns $10 per share and pays $6 in dividends, the payout ratio is 60%. That leaves $4 per share to reinvest in the business, pay down debt, or build a cash cushion.
A payout ratio that is too high is a warning sign. If a company pays out 100% or more of its earnings, it is paying more than it makes. That is not sustainable. It can only last by borrowing money, selling assets, or cutting the dividend.
| Industry | Healthy Payout Ratio | Why |
|---|---|---|
| Most industries | 35% to 60% | Leaves room to reinvest and absorb a downturn |
| Utilities and REITs | 60% to 90% | Stable, capital-intensive businesses |
| Consumer staples | 40% to 60% | Predictable demand but slower growth |
| Technology and growth | Little or none | Cash is reinvested in the business instead |
The safest payout ratio depends on the industry. Wellington Management and Hartford Funds research found that the safest historical payout ratio has been around 41%. That gives companies a cushion to absorb earnings declines without cutting the dividend. A company with a 41% payout ratio can see earnings drop 59% before the dividend is at risk. A company with an 80% payout ratio only has a 20% cushion.
Payout ratio is not the only red flag. Watch for these warning signs:
- Payout ratio above 100%: The company is paying more than it earns. The dividend is not covered by profits.
- Rising debt: If a company is borrowing to fund dividends, that is a red flag. Dividends should come from free cash flow, not from debt.
- Declining free cash flow: If the cash the business generates is shrinking, the dividend is at risk.
- A very high yield: If a stock yields 10% or more, the market is pricing in a dividend cut. Sometimes that is an opportunity. Often it is not.
- No dividend growth for years: A flat dividend is not necessarily a problem, but it often signals that the company has other priorities or limited cash.
Energy Transfer is a useful case study. It yields around 7.2%, one of the highest yields in the midstream energy sector. But it cut its distribution in half in 2020 during the pandemic energy downturn. It has since rebuilt the distribution above its pre-cut level and plans 3% to 5% annual growth. The high yield comes with a history of risk that investors need to weigh.
Sector Diversification
Dividend-paying stocks are not spread evenly across the market. Some sectors pay high yields, some pay low yields, and some pay nothing at all. If you only buy from one sector, you take on concentration risk. A downturn in that sector can wipe out both your income and your principal.
Here is how the major sectors look for income investors:
| Sector | Example and Yield | What to Know |
|---|---|---|
| Real estate, REITs | Realty Income near 6%, VICI near 6.78%, GLPI near 6.59% | Must distribute 90% of taxable income, average yield above 4%, rate sensitive |
| Energy, midstream | ET near 7.2%, EPD near 6.2%, ENB near 5.6% | Fee-based pipelines, less exposed to commodity prices, EPD has raised for 27 straight years |
| Consumer staples | PEP near 4.7%, MO near 6.8% | Stable demand in any economy, generally lower volatility |
| Utilities | DUK and peers in the 3% to 4% range | Regulated, predictable cash flow, moderate dividend growth |
| Financials and BDCs | ARCC and similar business development companies | High yields, credit risk, lend to middle-market companies |
| Healthcare | JNJ and MDT in the 2% to 3.5% range | Lower yields but strong dividend growth histories |
A balanced income portfolio might have 25% in REITs, 20% in energy, 20% in consumer staples, 15% in utilities, and the rest spread across financials and healthcare. That mix reduces the risk that one bad sector drags down your entire income stream.
Diversify across sectors that pay dividends. A portfolio of five 6% yielders in the same sector is not diversified. It is one bet with five tickers.
DRIP and Compounding
A dividend reinvestment plan, or DRIP, automatically uses your dividend payments to buy more shares of the same stock. It sounds simple, and it is. But the effect over time is powerful.
Here is why. When you reinvest dividends, you own more shares. Those new shares pay dividends too. The next dividend buys even more shares. Over years, the number of shares you own grows, and the income they generate grows with it. This is compounding, and it is the single most important tool for building long-term dividend income.
Consider a $50,000 portfolio with a 4% yield. If you take the dividends as cash, you collect $2,000 per year. After 20 years, you have collected $40,000 in income, and you still own the original $50,000 in stock, assuming no price change. If you reinvest the dividends and the stock has a 4% yield with 4% dividend growth, your income after 20 years is roughly $4,400 per year, and your portfolio value has grown substantially because you own more shares.
The difference is even more dramatic over longer periods. Studies have shown that reinvested dividends account for a large portion of total stock market returns over decades. One analysis found that a $10,000 investment in the S&P 500 with dividends reinvested grew to $42,250, while the same investment without reinvestment grew much less.
Most brokers offer automatic DRIP enrollment at no cost. You can also set up DRIPs directly with some companies. If you are investing through a tax-advantaged account like an IRA, reinvesting dividends is almost always the right move because you defer taxes on the income until you withdraw. In a taxable account, you owe taxes on dividends whether you reinvest them or not, so you might as well let them compound.
The one exception is if you need the income now. If you are already retired and living off your dividends, you might want to take the cash instead of reinvesting. That is fine. The point of building income is to use it. Just understand that once you stop reinvesting, the compounding stops. If you are still deciding how much of your portfolio should sit in high-yield dividend names versus broad index holdings, a quick run through the stocks hub helps frame the trade-offs.
Tax Treatment
How much of your dividend income you keep depends on how it is taxed. There are two main categories: qualified dividends and ordinary dividends. The difference is significant.
Qualified dividends are taxed at the long-term capital gains rates, which are currently 0%, 15%, or 20%, depending on your taxable income. Ordinary dividends are taxed at your regular income tax rate, which can be as high as 37%. That is a huge gap.
To qualify for the lower rate, a dividend must meet two conditions. First, it must be paid by a US corporation or a qualifying foreign corporation. Second, you must have held the stock for more than 60 days during the 121-day window surrounding the ex-dividend date. If you buy a stock and sell it quickly around the dividend date, the dividend may not qualify. Long-term buy-and-hold investors almost always meet the holding period requirement.
| Rate | Single | Married Filing Jointly |
|---|---|---|
| 0% | Up to $49,450 | Up to $98,900 |
| 15% | $49,451 to $545,500 | $98,901 to $613,700 |
| 20% | Above $545,500 | Above $613,700 |
An additional 3.8% net investment income tax may apply if your modified adjusted gross income exceeds $200,000 for single filers or $250,000 for married filing jointly.
Not all dividends qualify for the lower rate. Dividends from REITs, business development companies, and most foreign corporations are usually taxed as ordinary income. That is a real drawback for high-yield REIT investors, though REIT dividends often include a return of capital component that reduces the tax bill. The 199A deduction allows investors to deduct up to 20% of qualified REIT dividends, which lowers the effective tax rate.
The tax treatment makes a strong case for holding your highest-yielding stocks, especially REITs and BDCs, inside a tax-advantaged account like an IRA or 401(k). That way, the income compounds without an annual tax drag. Keep your qualified dividend payers in taxable accounts, where you can take advantage of the 0% or 15% rate.
The Bottom Line
Building passive income with dividend stocks requires more than chasing the highest yield. The S&P 500 yields just over 1%, so you have to look beyond the index for meaningful income. But high yield without growth is not enough. The best income portfolios combine stocks that pay well today with stocks that will pay more tomorrow.
Focus on companies with healthy payout ratios, preferably between 35% and 60% for most industries. Diversify across sectors like REITs, energy, consumer staples, and utilities so that one downturn does not wipe out your income. Reinvest your dividends to let compounding work in your favor. And pay attention to taxes. Holding REITs and other ordinary-income payers in a retirement account can save you thousands over time.
Start by deciding how much income you need and what yield you can realistically achieve. Then compare your options and check your asset allocation to make sure dividend payers fit alongside the rest of your portfolio. The best dividend stocks are not the ones with the highest yields. They are the ones that keep paying and growing, year after year.
Frequently Asked Questions
How much do I need to retire on dividends?
A common rule of thumb is to multiply your desired annual income by 22 to 28. That range assumes a starting portfolio yield of about 3.5% to 4.5%. If you need $70,000 per year in dividend income, you would target a portfolio of roughly $1.5 million to $2.0 million. If you only need dividends to cover part of your expenses, the required portfolio is smaller. Social Security, pensions, or part-time work can reduce the amount you need from dividends.
What is a safe yield?
A safe yield depends on the company and the sector. A utility yielding 3% with a 60% payout ratio and a long history of dividend increases is probably safer than a mortgage REIT yielding 12% with an 80% payout ratio. In general, anything above 8% deserves extra scrutiny. The market is pricing in risk when a yield gets that high. Check the payout ratio, the free cash flow, and the debt levels before you assume a high yield is safe.

